


Connect with isaac tonyloi.

photo credit: Pinterest
Data has really become an important part of our daily lives, it essentially drives every decisions that we make, be it in big organizations or in SME’s and even at personal levels.
But the big question is how accurate are the decisions that we make based on the data that we are collecting? The quality of the models upon which we base our decision heavily relies on the authenticity of the data that we obtain.
When obtained directly from the source, data is not usually in the form that can be directly used in decision making, it needs some tweaks before it can be deemed fit for use in making important decisions. In this article I’ll highlight some of steps that we can take in making our data fit for modelling;
1.Handling Missing values.
Missing values may arise as a result of different issues , the data set may be typically containing missing because they were not recorded or as a result of joining different tables resulting to a missing value.
In R is.na() is the typical method we use when checking for missing value in atomic vectors pair-lists, lists and NULL. The method returns a logical value True for missing values and False if otherwise. You can also use the function sum(is.na()) to get the sum of the missing values marked NA in your data.
There are quite a number of ways you can treat missing data if found to be present;
a) DELETION
Is one of the easiest ways of handling you can choose to either do a pairwise deletion which entails analyzing the data without missing values or do a list wise deletion where you do away with the entire row containing missing values.
b) IMPUTATION.
Under this technique we usually replace the missing data with either the mean, mode or median. This kind of imputation can be classified into two types; the general imputation method one where we compute the the mean or median of all the existing data and use it to replace all the missing data. We also have Specific case imputation, in this case we calculate the mean for each set of data and replace each set of missing values with the respective mean computed from each of the existing values of the given data-set (seek further clarification from other sources
2. OUTLIERS.
According to Wikipedia an outlier is data point that differs significantly from the rest of the observations. When it comes to analyzing data they may lead one to make a wrong conclusion. Whenever an outlier is present in data that alone is enough to raise suspicion that there might be a problem in your data. Presence of outliers may be due to an error that occurred during the collection of the data. It is therefore prudent to first check out for outliers before proceeding to analyze data.
a)Inspecting the Data
Depending on the type of data you’re dealing with sometimes by just inspecting the data it is possible to site a possible outlier for instance if youre dealing with the life expectancy of human being an outlier might be easily spotted in case there is a value that is way above 100 yrs, or if it is is a hospital setting a data involved could be the blood pressure of individuals the having prior knowledge of what the normal range of blood pressure is expected alone is enough to spot an outlier.
b)Mean, Mode and Visualization charts.
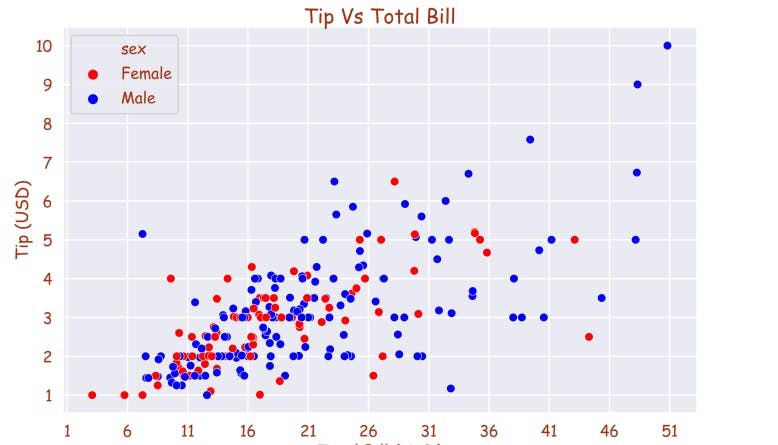
photo credit https://ravedata.in/data-visualization/scatterplot/
The mean and mode are also Important measures of central tendency that can give you a clue of there being a possible outlier in your data , because as their name suggests they give an hint as where most of the values of the dataset lie.
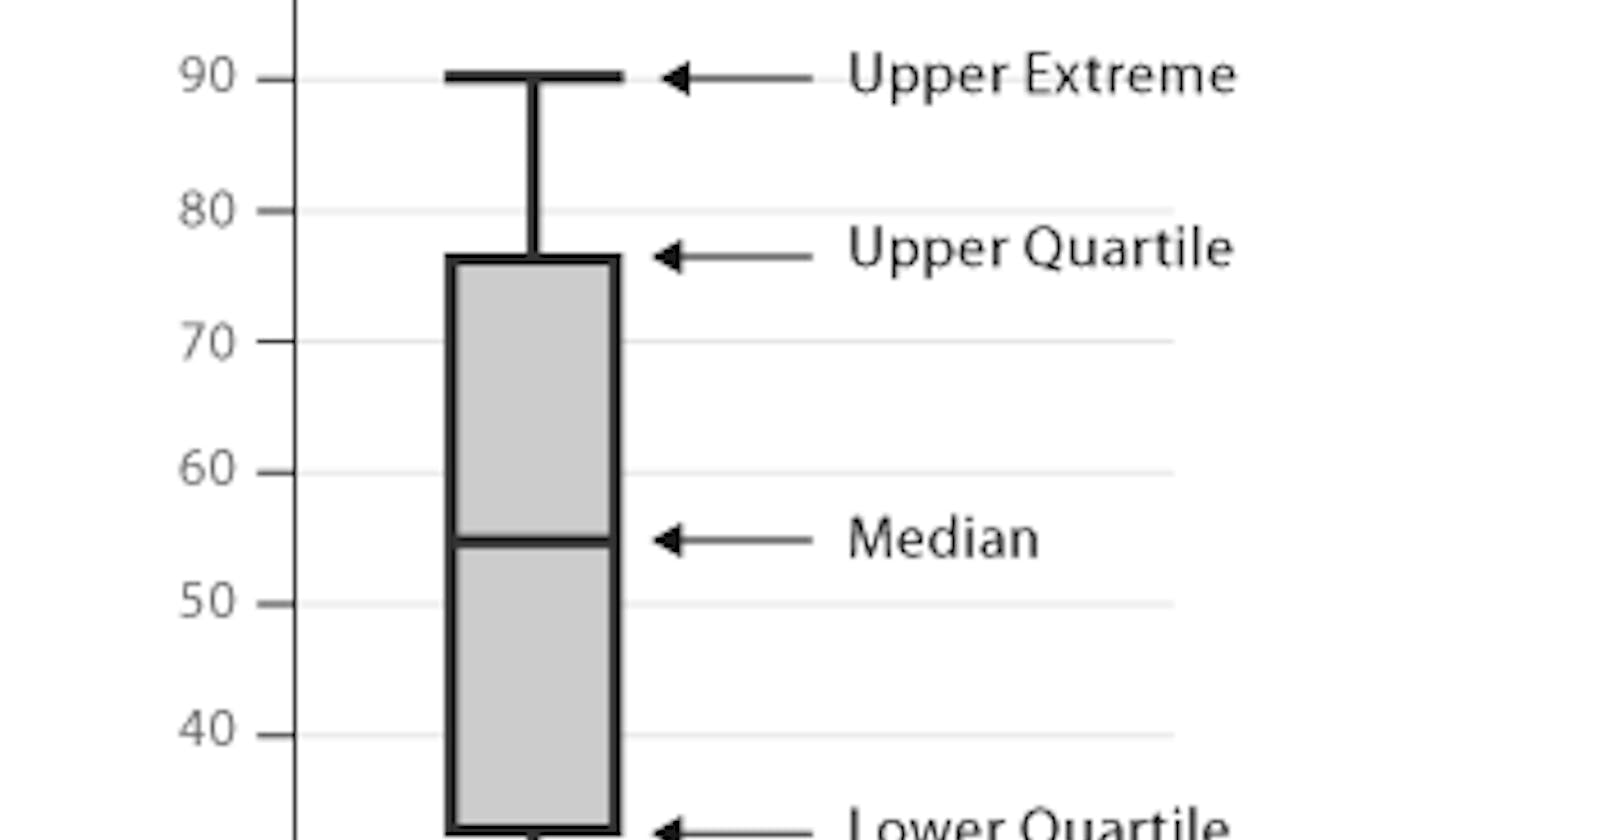
Besides all this you can go ahead and use one of the most common types visual tools this can be a Box plot ,Line graph or the Scatter-plot . The box plot is usualt the most effective besides the scatter plot in detecting outliers.
boxplot(data)
photo credit:https://www.pinterest.com/
3. VARIABLE TRANSFORMATION.
Even before you test and deploy that model you have been working on it some times good to check whether your data conforms with the assumptions that you have made. For instance in linear regression there is the assumption of; normality of errors, homoscedasticity and linearity if one or more of the above assumptions is violated than we will have a reason to transform the variables.
Another reason that could force you to do variable transformation of dimensionality reduction using methods such Principal component Analysis is if you wish to simplify your visualization for easier interpretation.
Conclusion
To spare yourself of the trouble of coming up with hyper-parameters in trying to improve your models accuracy it is a good practice to consider data pre-processing as on of the most first and vital step towards building and deploying amazing machine learning models or when performing data analysis.